
Gold - Getting More Interesting

My first Substack article was sharing some key Risk Management Indicators for investing in Gold
It can be found below
I recently watched a video interview with Victor Sperandeo by Grant Williams. (Victor is a market legend and his view should be highly respected). In the video, Sperandeo shares that despite rigorous back testing - he cannot find a single repeatable quantitative signal in Gold.
That’s why gold bugs are the original Hodlers.
With that being said - I would like to share some charts that I think are starting to make Gold look more interesting on the long side in the coming months.
When Gold topped in 2020 - it was trading 20% above its 200dma. This has been a very reliable signal to cut length over the last cycle
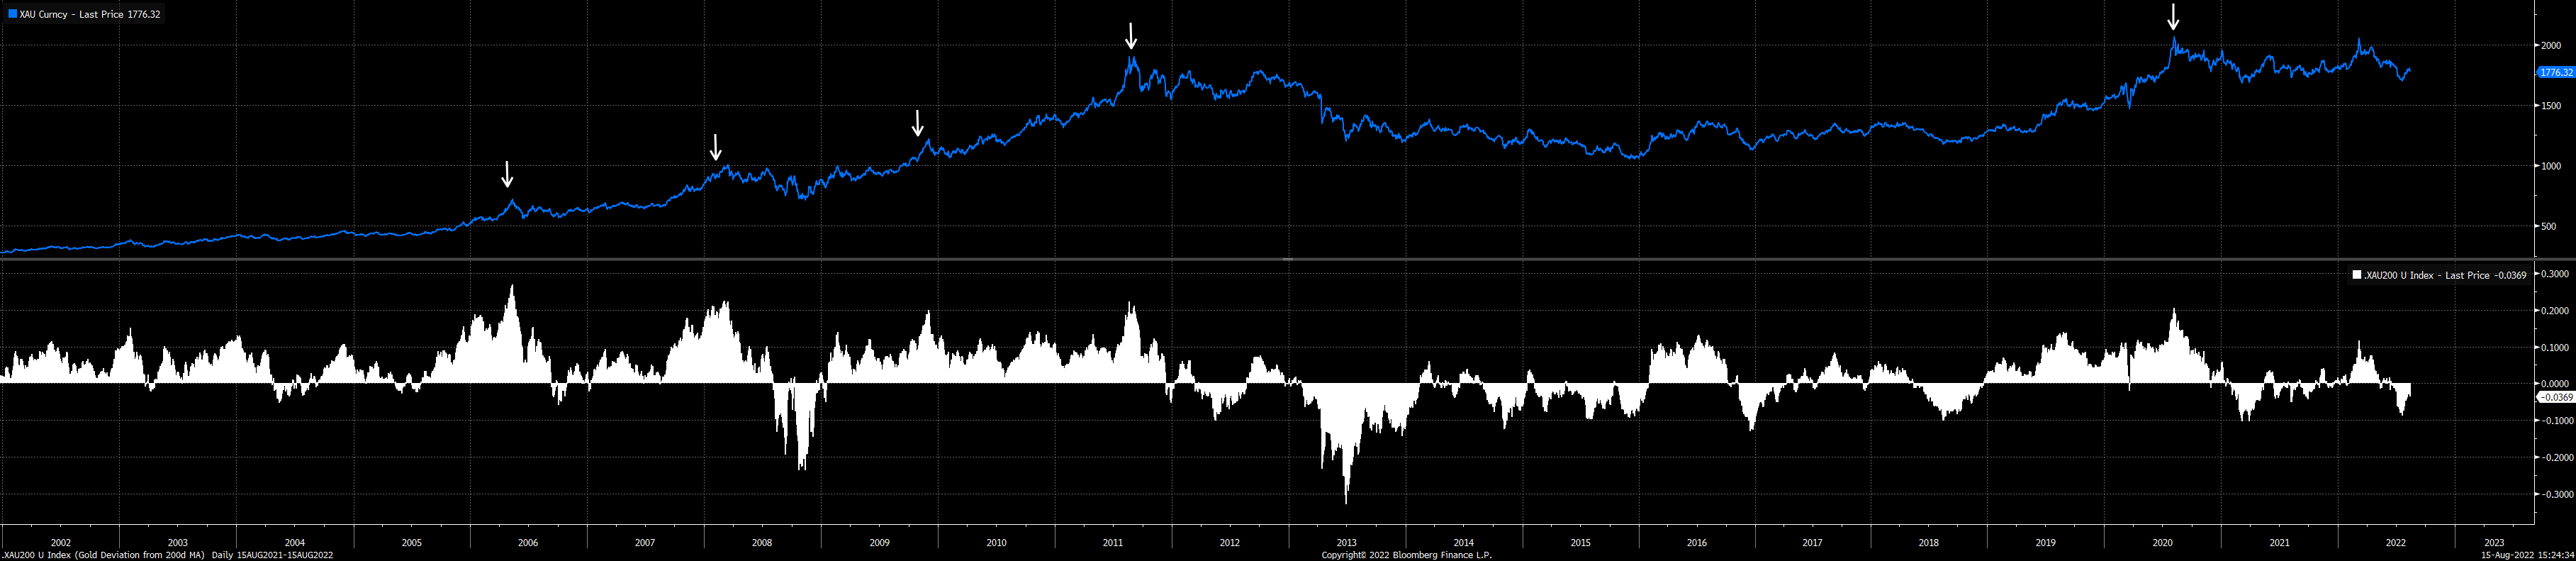
If we look at the gap between these highs and new highs the gaps are as follow
2006 = 369 Days
2008 = 288 Days
2009 = 119 Days
2011 = 2313 Days
Current = 526 Days
The value of these momentum indicators is high - holding a drawdown of the any of the periods above is hard.
So what is perking up my interest now.
Let’s run through the charts.
My Elliot Wave - Wave Count is the below:
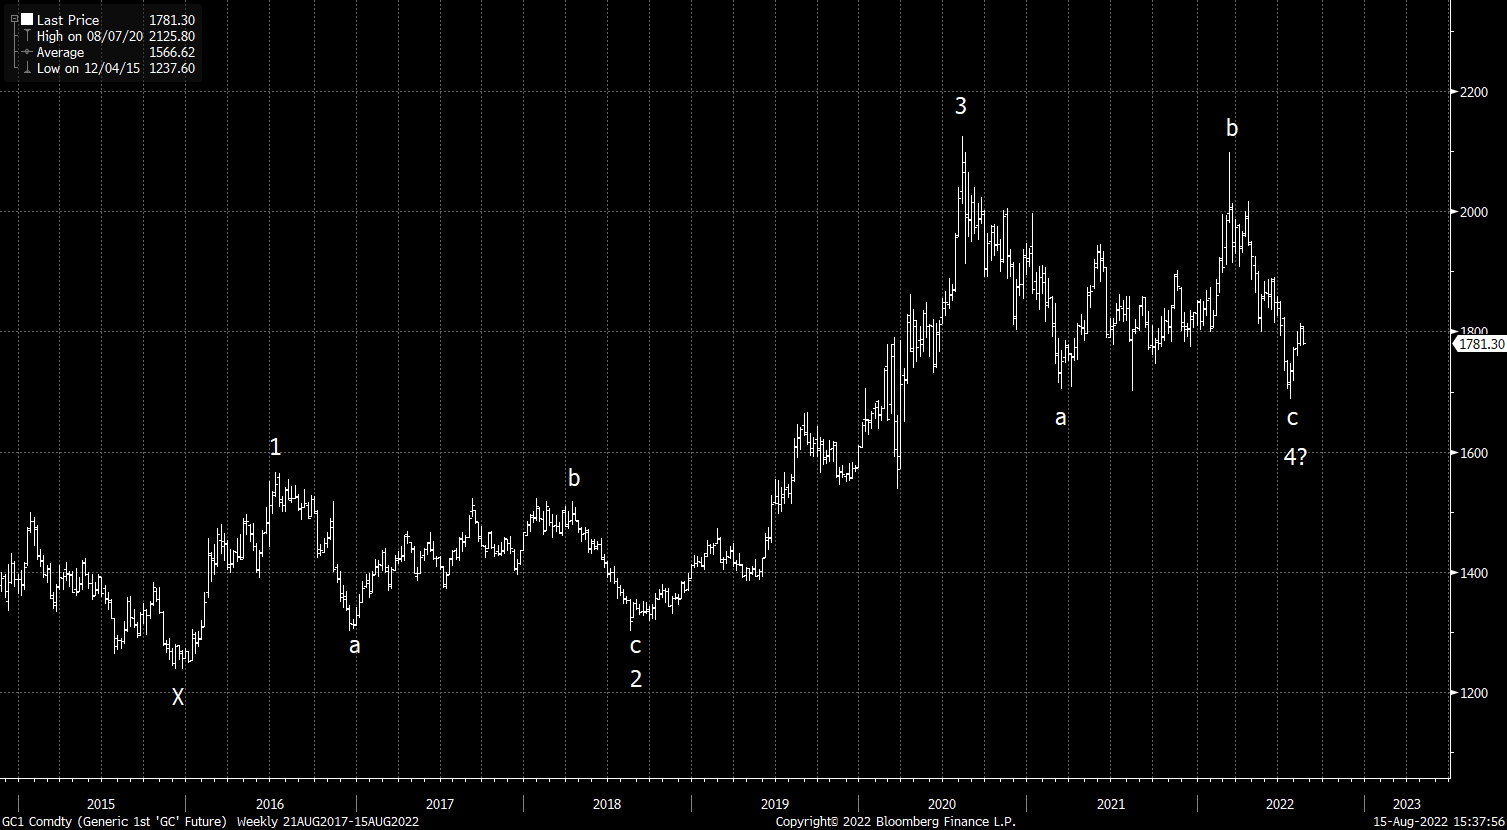
Note the very mild undercut of Corrective Wave C to make Wave 2 low is very similar to where we are today. (Note these charts include roll yield and will differ to spot charts)
Wave 2
Potential Wave 4

(a degree of this price action may well be Elliot Wave focused buyers creating a self fulfilling prophecy)
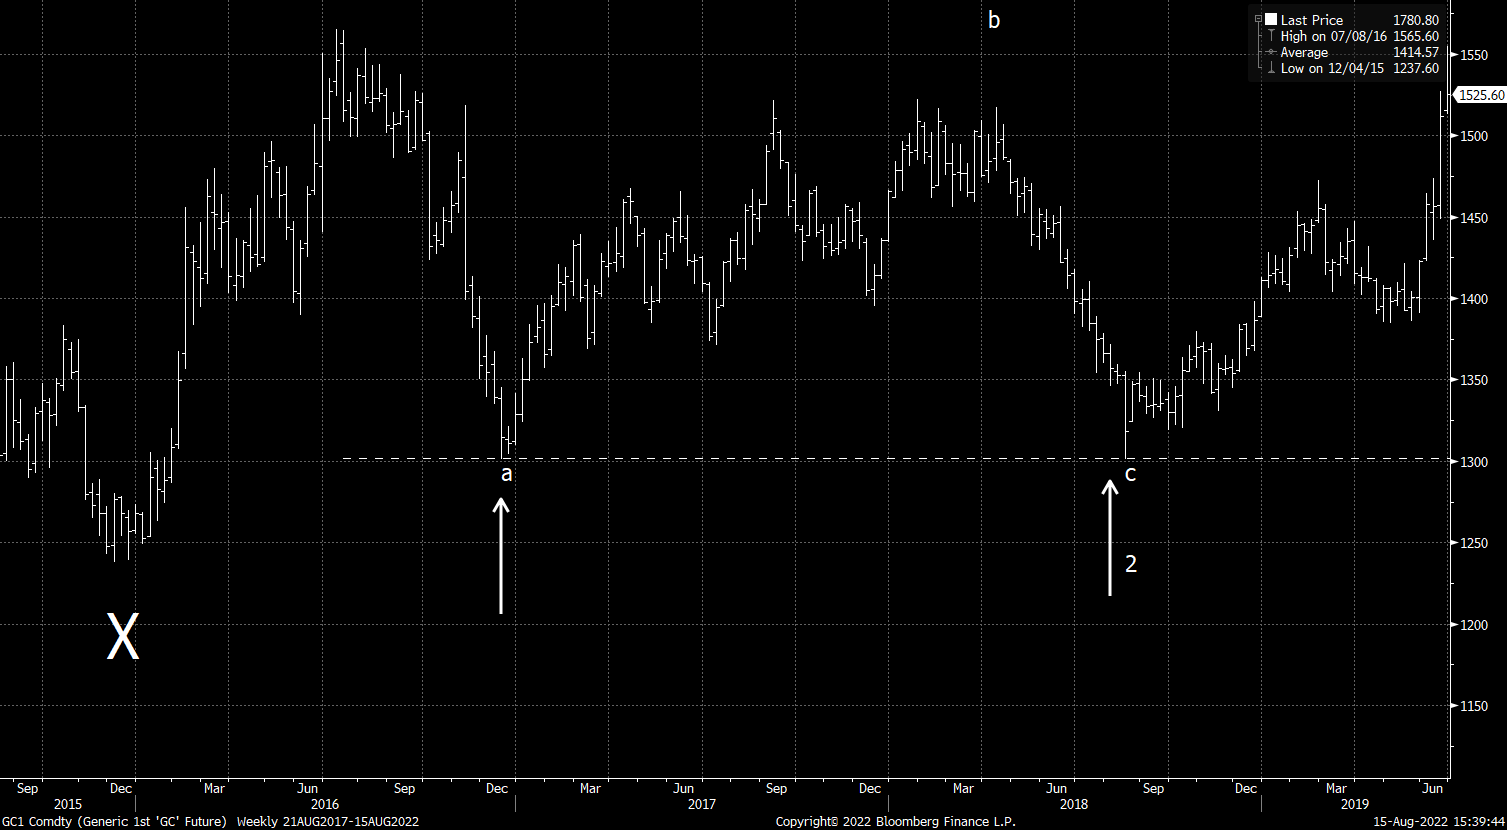
However there are other symmetries that are also interesting.
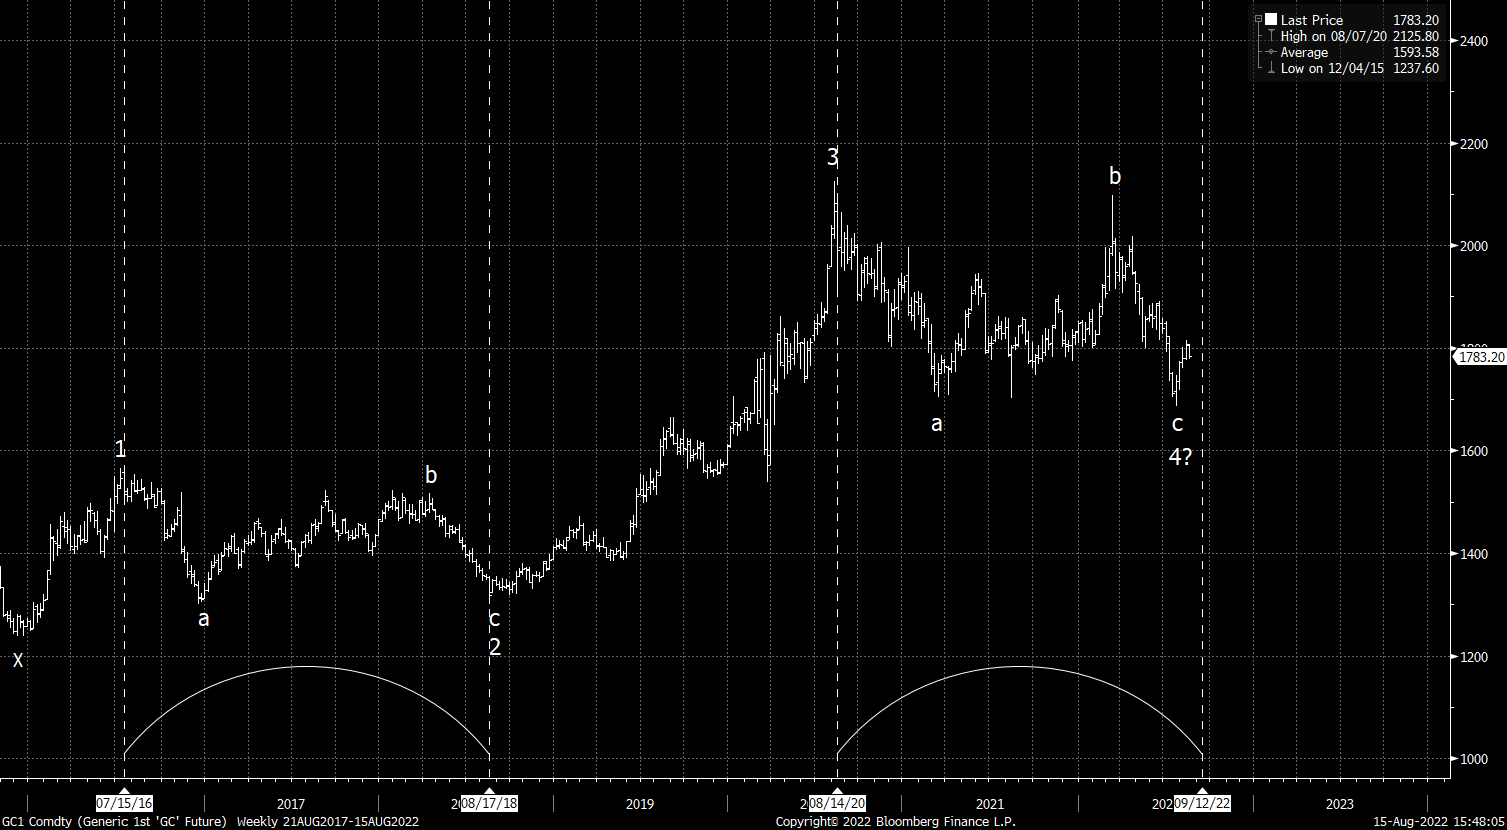
Both ABC’s are technically very symmetrical both in price and duration
Price Chart

Duration
Then we revert to the main charts
My two go to charts are XAU/CNY and XAU/ADXY
Notice how the break of the XAUCNY downtrend in 2018 really kick started the most recent gold move
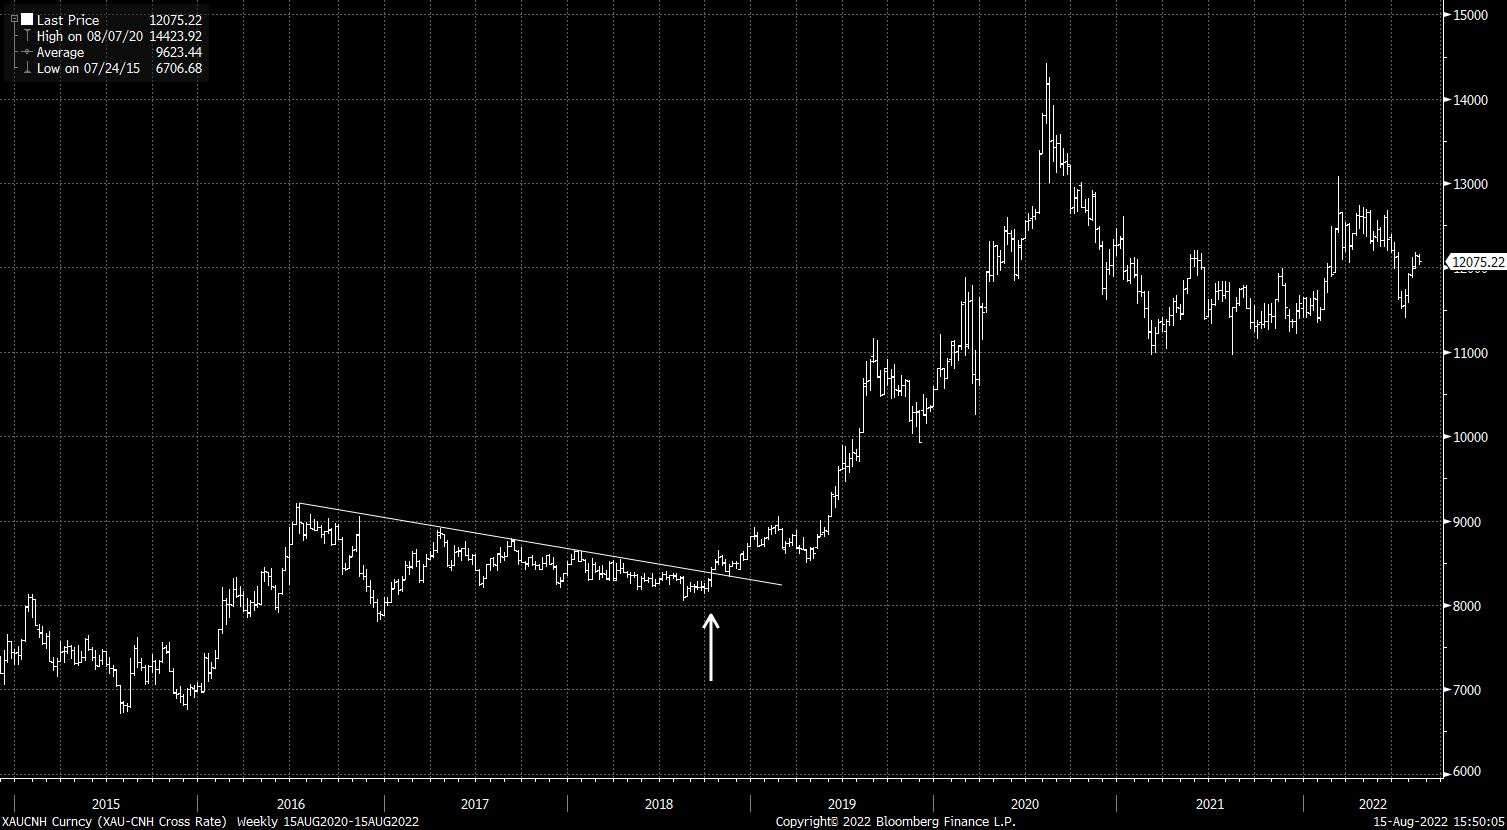
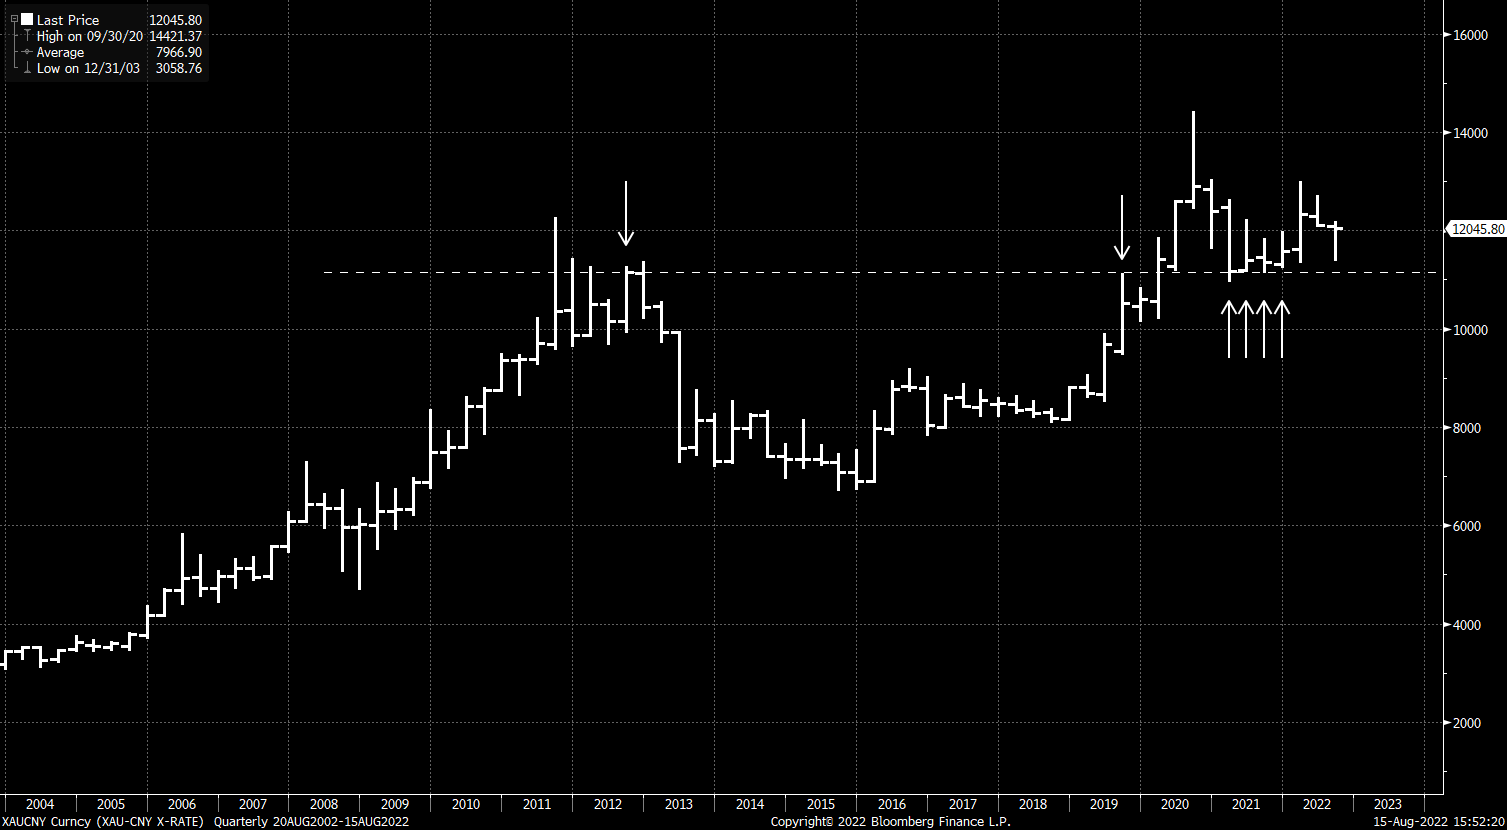
XAUCNY pierced previous Gold quarterly closing highs in 2020 and has been slowly consolidating above this new support line. All of the excess momentum from the breakout has now been burnt off.
Broader Asian FX has been weaker than CNH so XAU/ADXY re-test the 2011 highs and bounced higher before consolidating

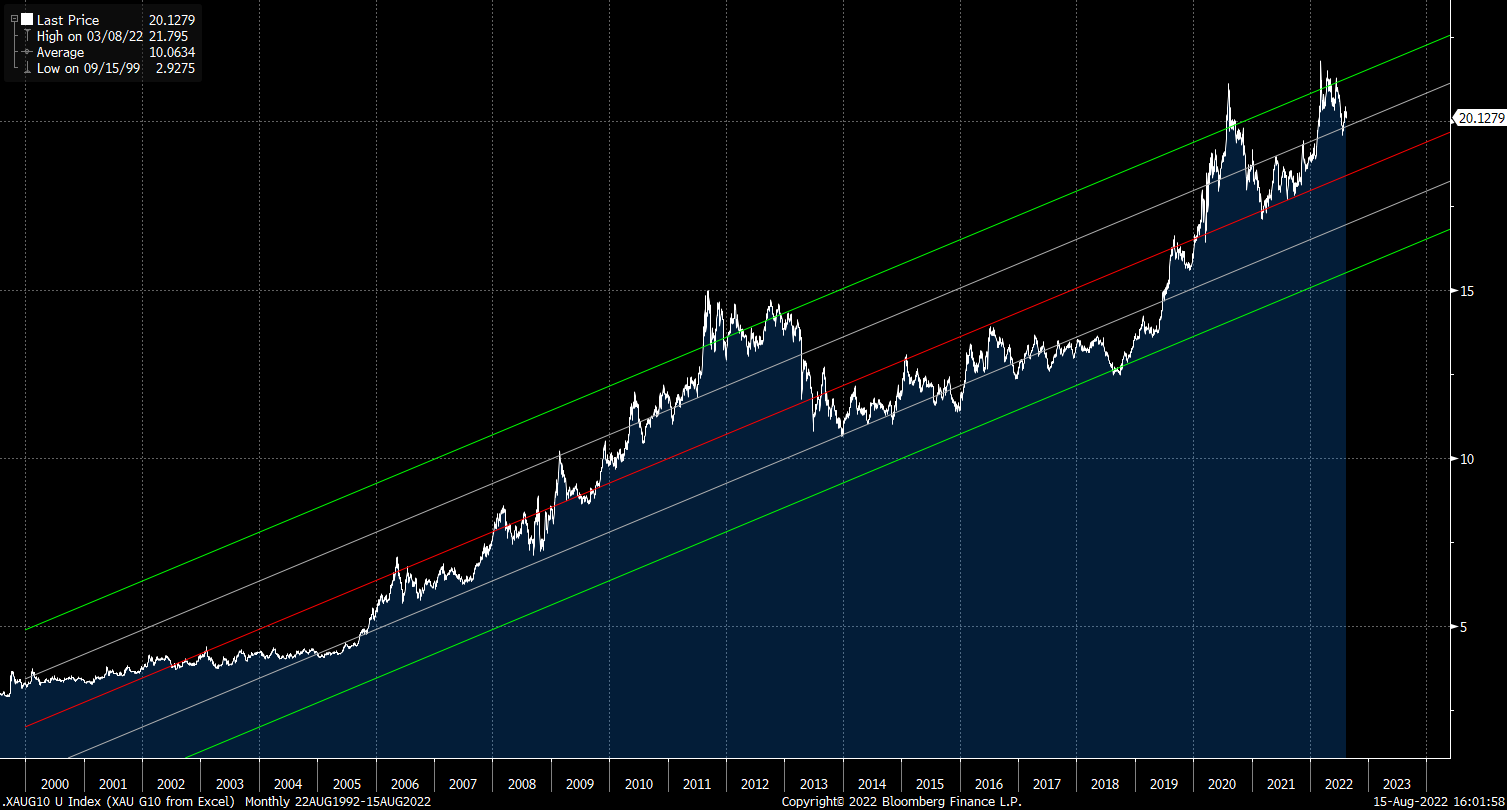
I have played around by making an equal weight G10 Gold Price and that is actually trending to new highs

This series makes me a little move nervous as it is trading at the top of its regression over the last 20 years
To me - the hard line in the sand remains 11150 XAU/CNY on a quarterly closing basis for a full loss of bull trend.
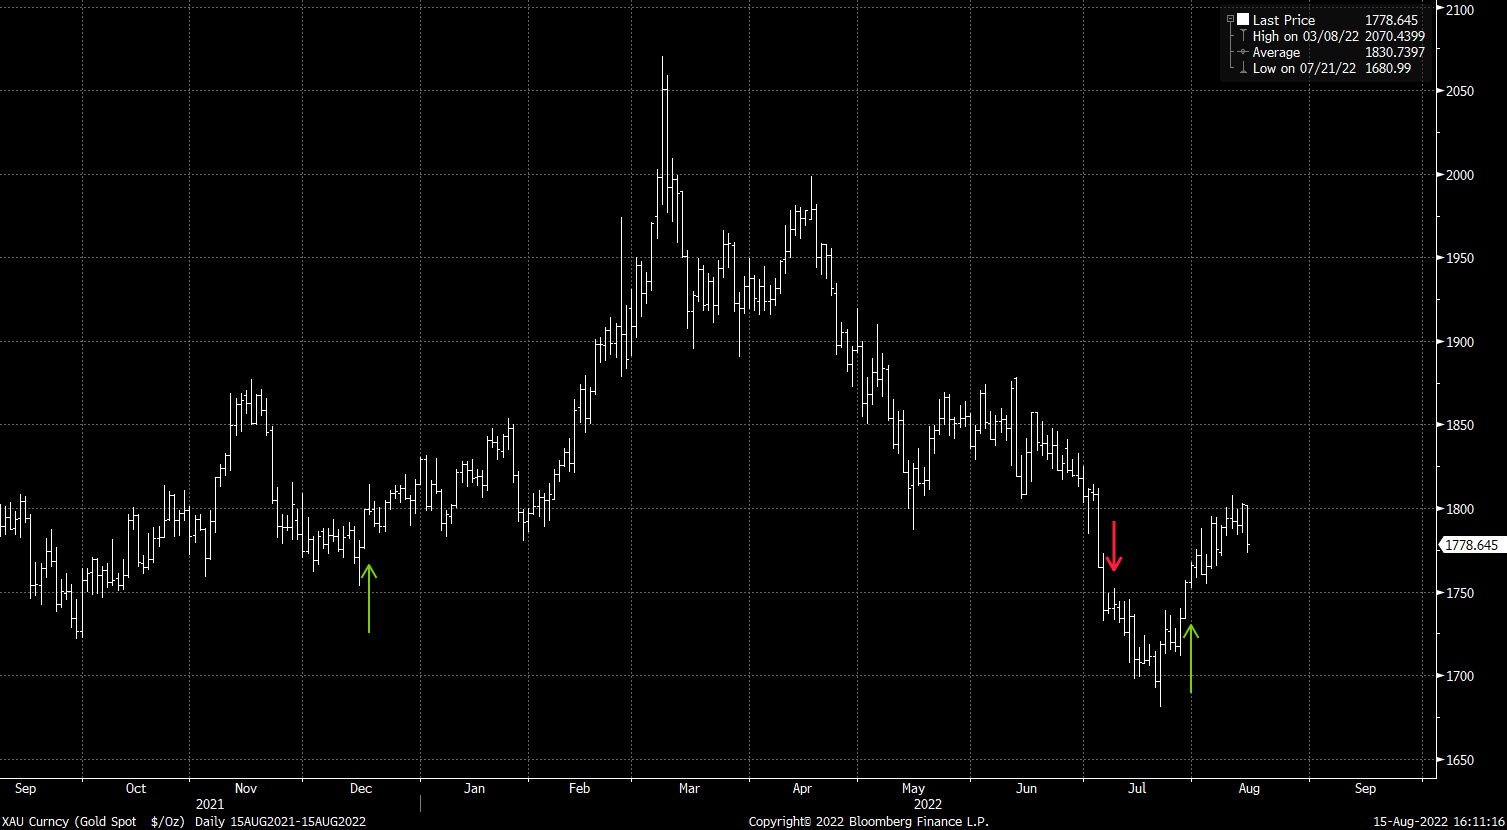
We can follow this up by looking at what the Gold Trend Model says that was discussed in the original Substack note.
After a sell signal firing at the start of July - the model now recommends getting long again.

The last 3 signals are shown on the chart below
And then there is liquidity indicators.
Whilst still in the dumps - the Crossborder Capital data is starting to pick up

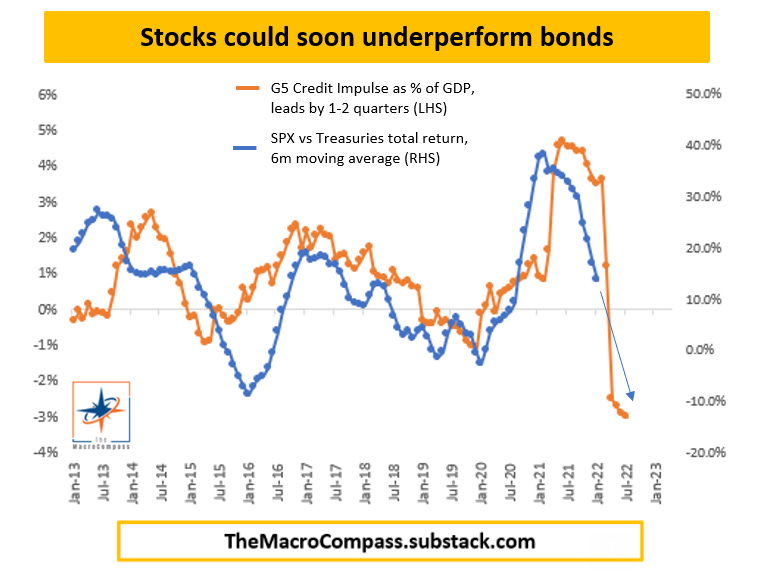
We are also seeing the G5 Credit Impulse (orange line) slowing/bottoming
That brings us finally to positioning.
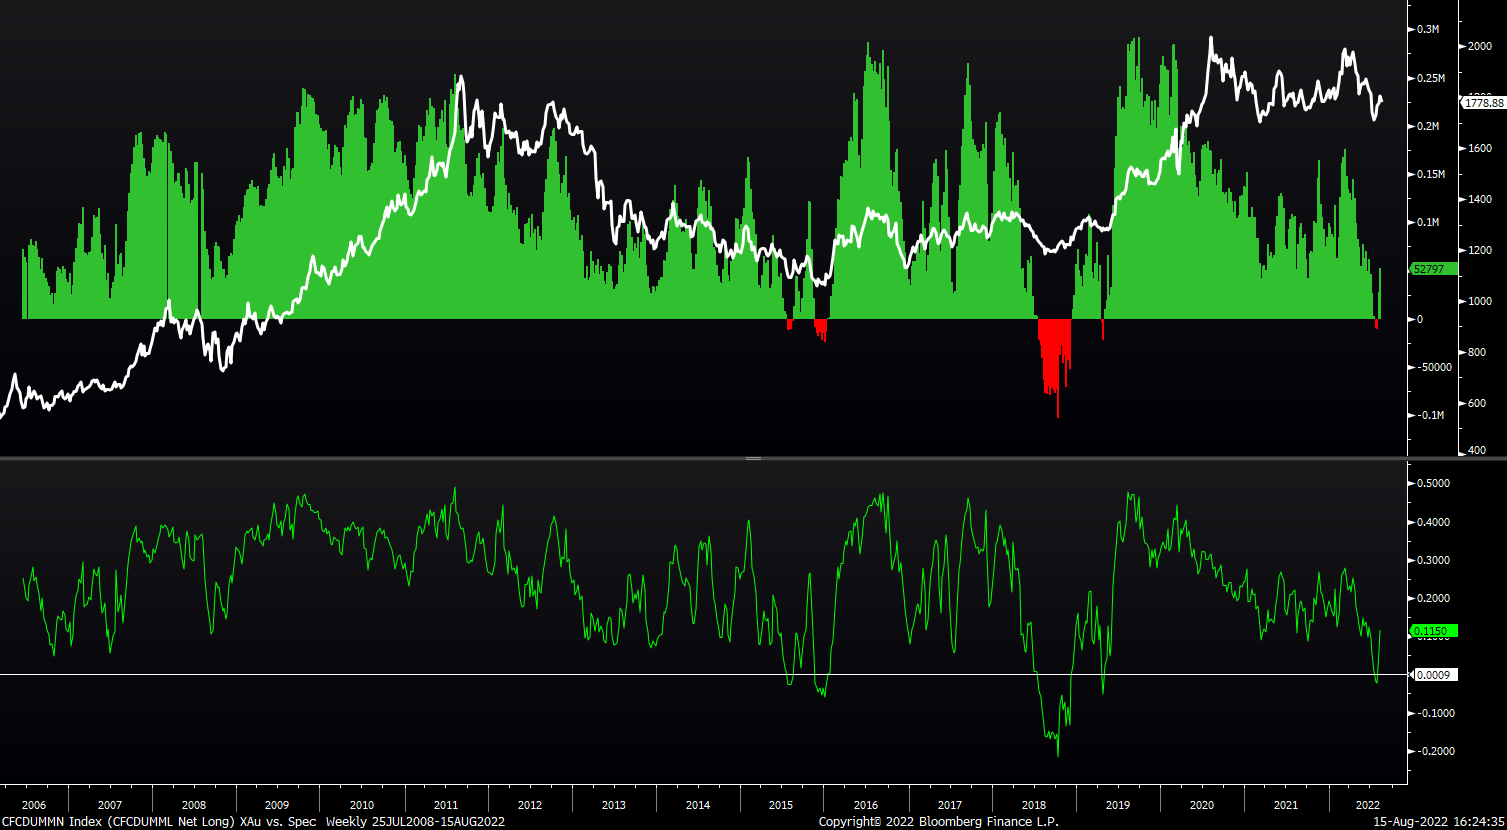
Essentially all of the speculative futures length from the previous run up in prices starting in 2018 has unwound.
White Line = XAUUSD
Red/Green Histogram = Net Spec Contracts
Lower Green Panel = Spec Position as a % of OI
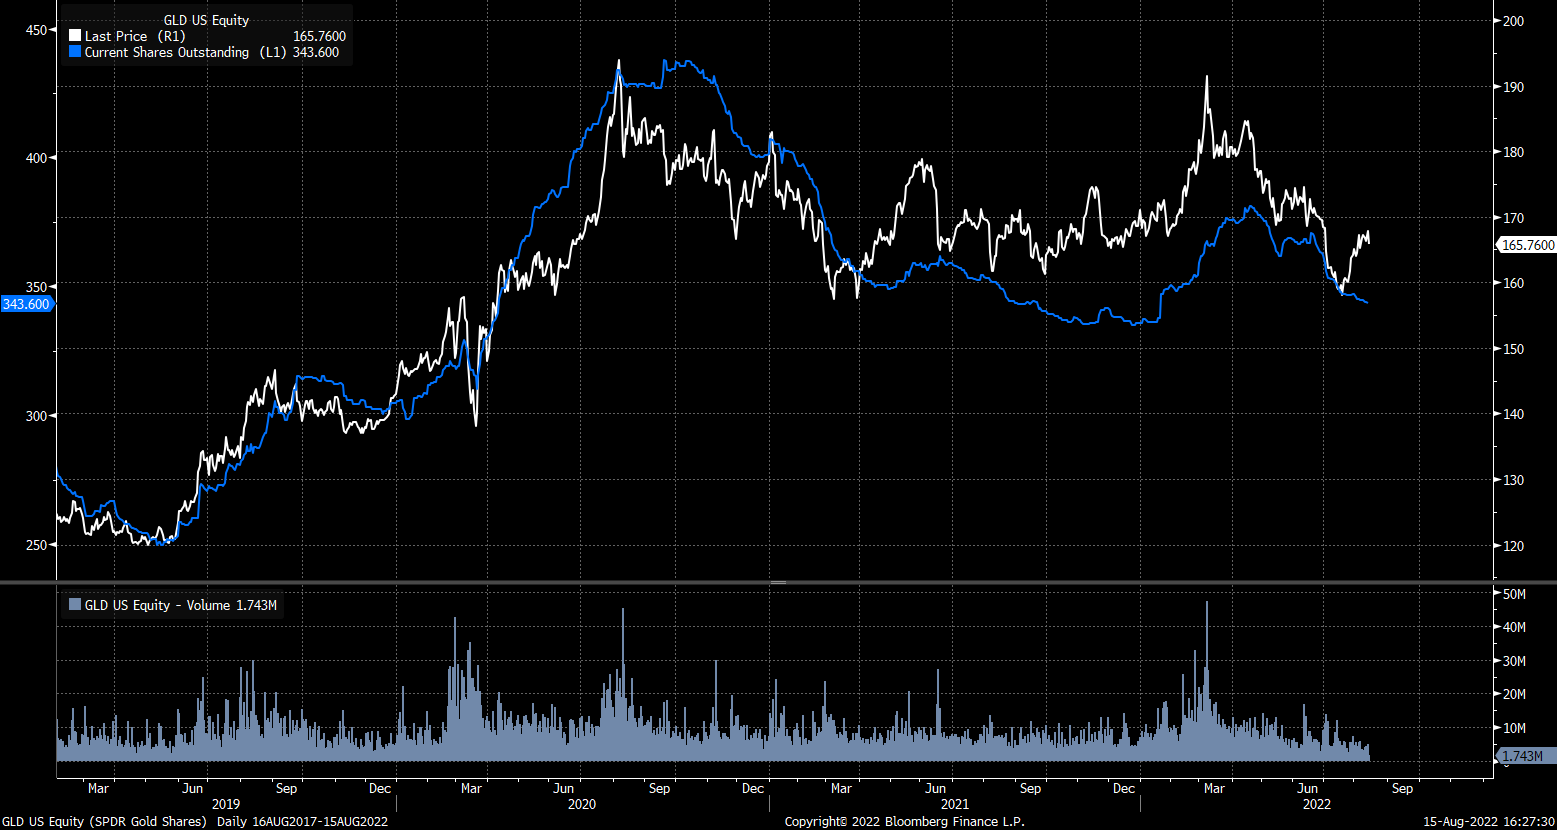
ETF Buyers are continuing to liquidate length and fade the rally.
Blue Line = Shares outstanding in GLD
The elephants in the room are Real Rates and USD
5y Real Rates suggest Gold could retrace the whole rally from 2018
Green = 5y Real Yield
White = Gold Inverted
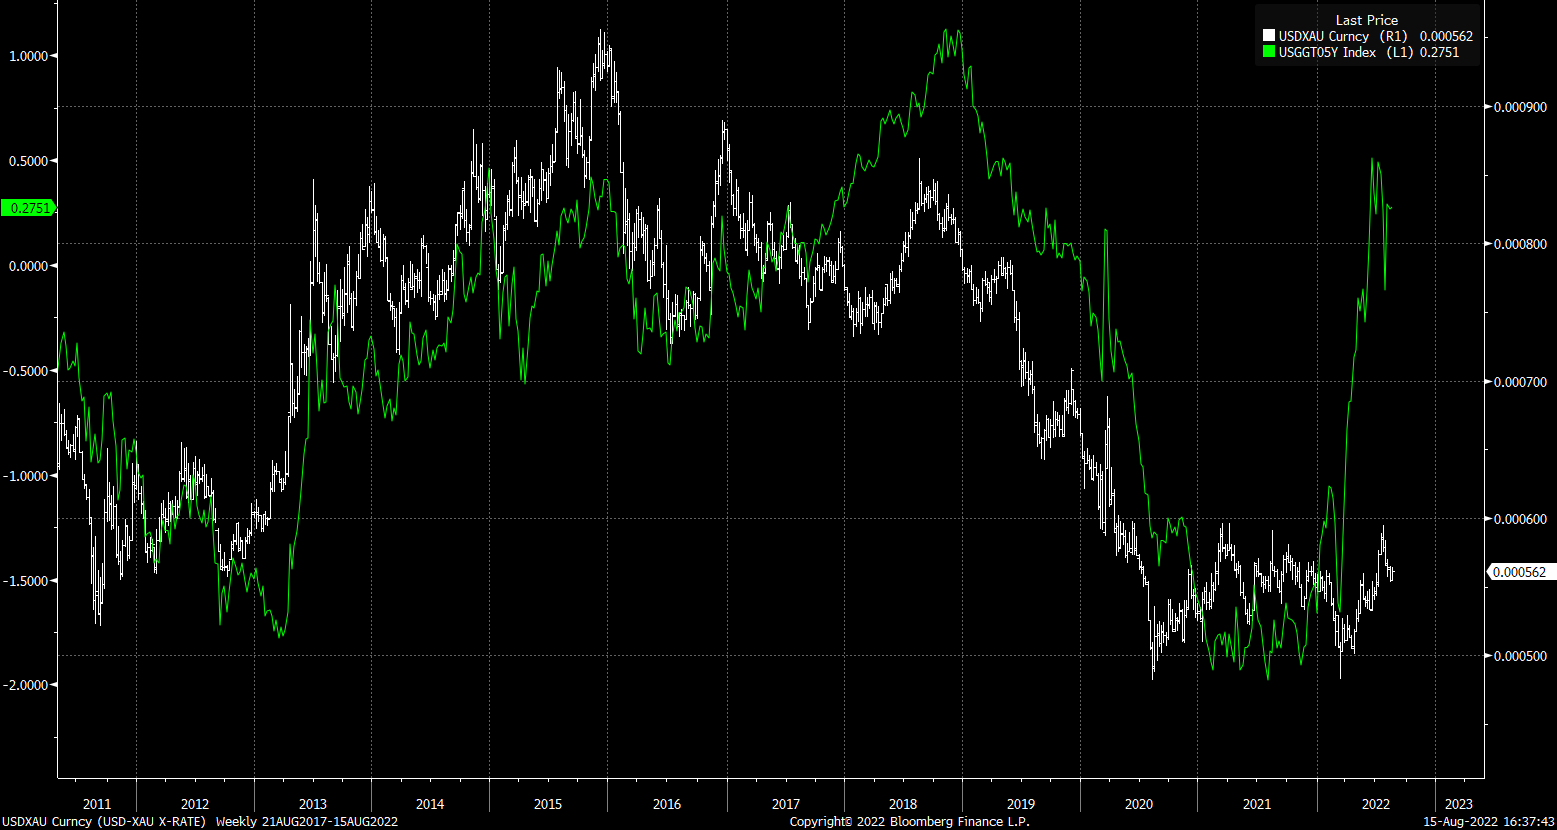
We have had similar divergences to this in recent memory - most notably into the GFC

However - it must be noted that this was during a weak USD environment.
A bit of a chart heavy piece. I needed to dump some thoughts from in my head onto paper.
In Summary:
A number of technical, positioning and liquidity based factors are suggestive that Gold could find a bid into year end
Extremes from the recent bull move have dissipated and the market looks more balanced
Real Rates and USD remain headwinds - although there is some precedent that these correlations can periodically break.
Good Luck
If you enjoyed this piece - please help share my work by clicking the below