
Deflationary Pulses - An Increasingly Blunt Axe
Deflationary Pulses - An Increasingly Blunt Axe

I recently saw a panel topic that got me thinking:
Panel 4: What Will Be the Catalyst for the Next Tail Event and How to Hedge It
I’m going to ignore the latter part of the topic and refrain from recommending specific trades - however I will elaborate on what I feel is one of the lesser understood tails in the market.
Let’s start by talking about the tails that - at this point - are pretty well understood by the market:
China Property Sector Implodes
China invades Taiwan
Fed turns Paul Volker
Europe implodes due to energy crisis
ALL of which have a lot of merit.
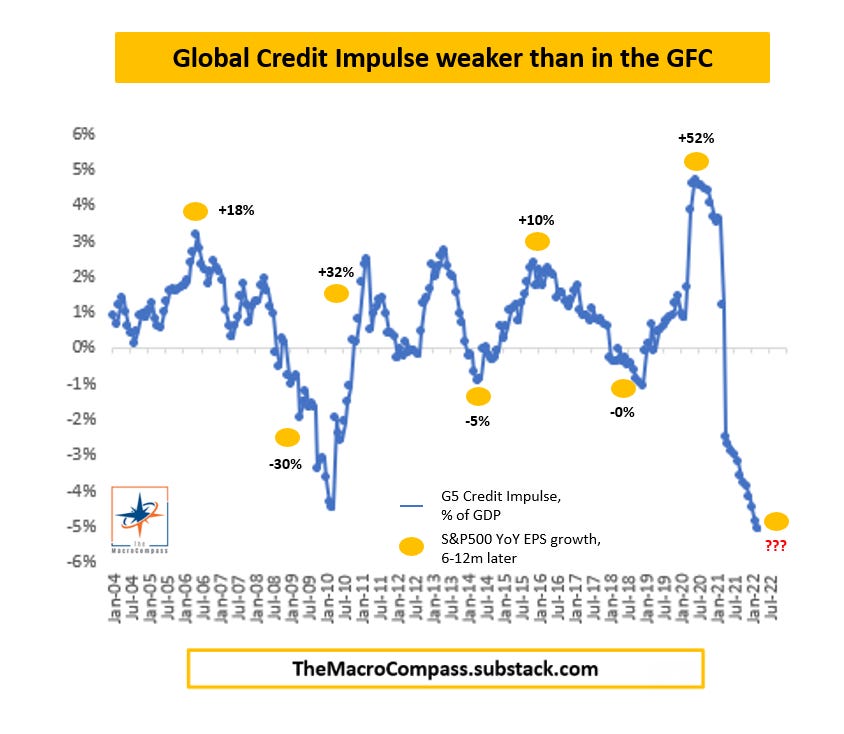
The Credit Impluse and Global Liquidity are VERY weak and as Warren Buffett told us:
Only when the tide goes out do you discover who's been swimming naked.
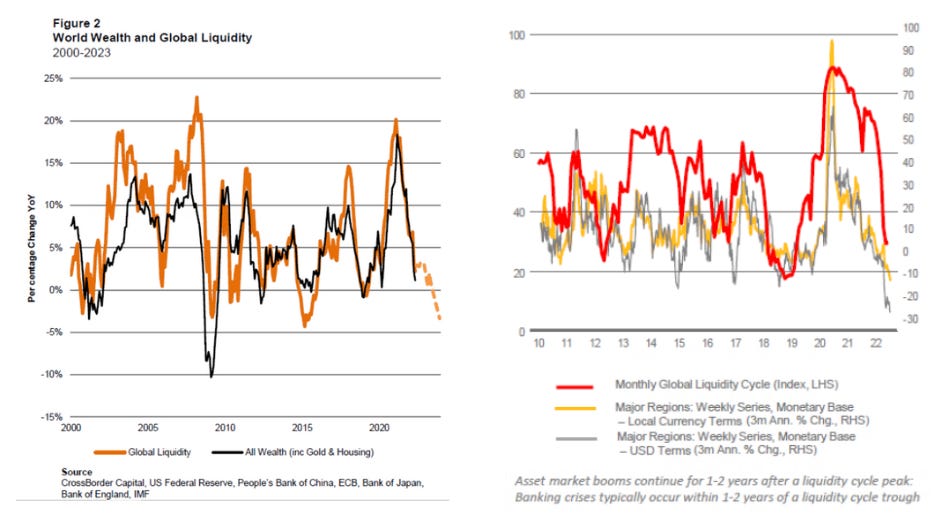
The best two metrics I have seen for Liquidity/Credit in the system are The Macro Compass Credit Impulse and Cross Border Capital’s liquidity data. They are fairly similar data series’
All of the above should lead to immense deflationary pressure over the next year or so. Whether that means a material decline from current - very elevated - levels or actual negative inflation prints remains to be seen.
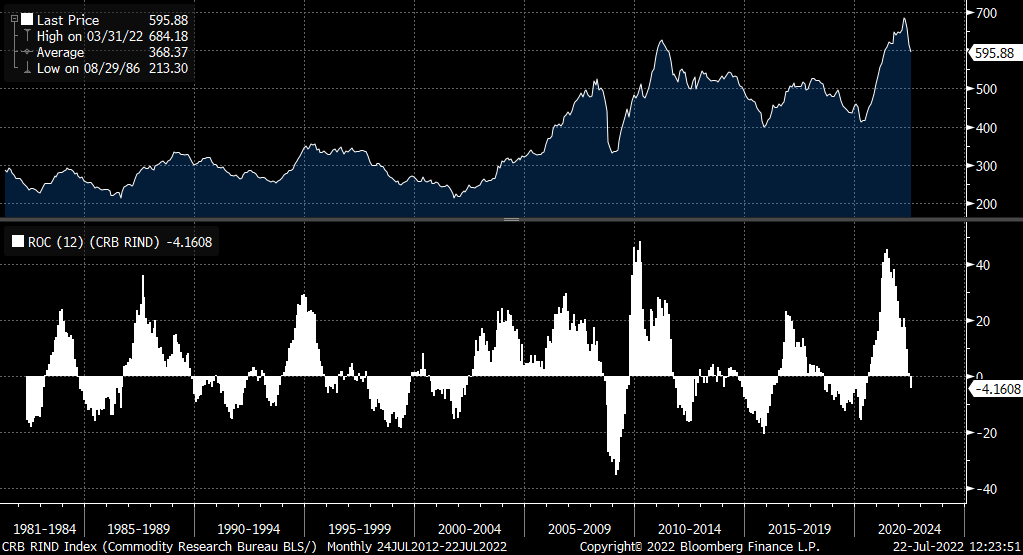
What we have been seeing generally is that raw commodity inputs (goods) have been starting to decline and services have been accelerating.
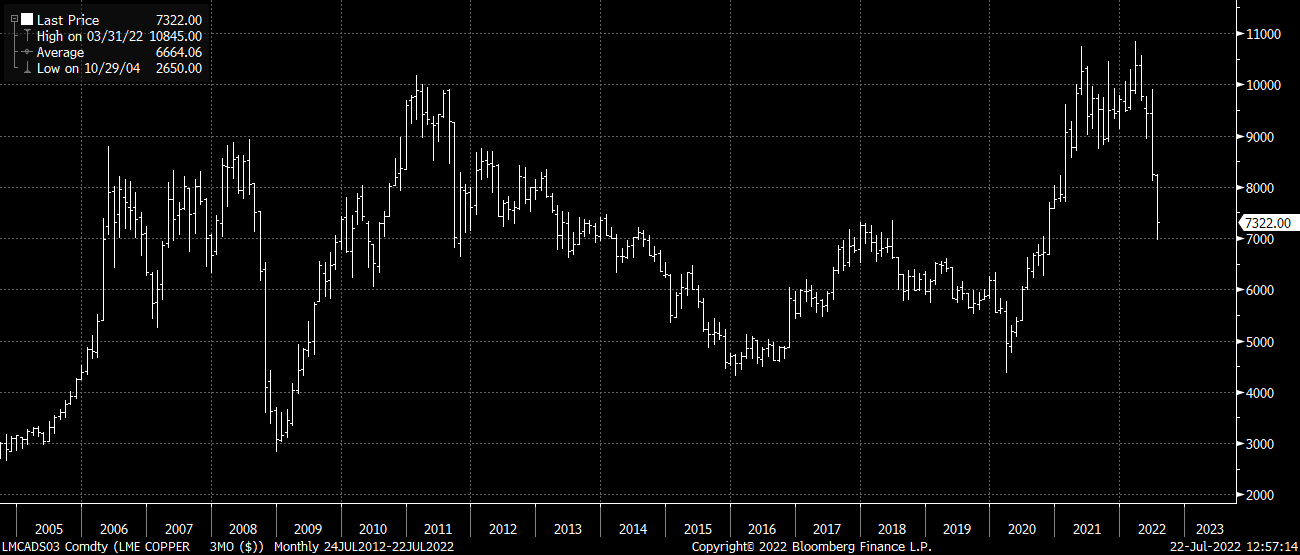
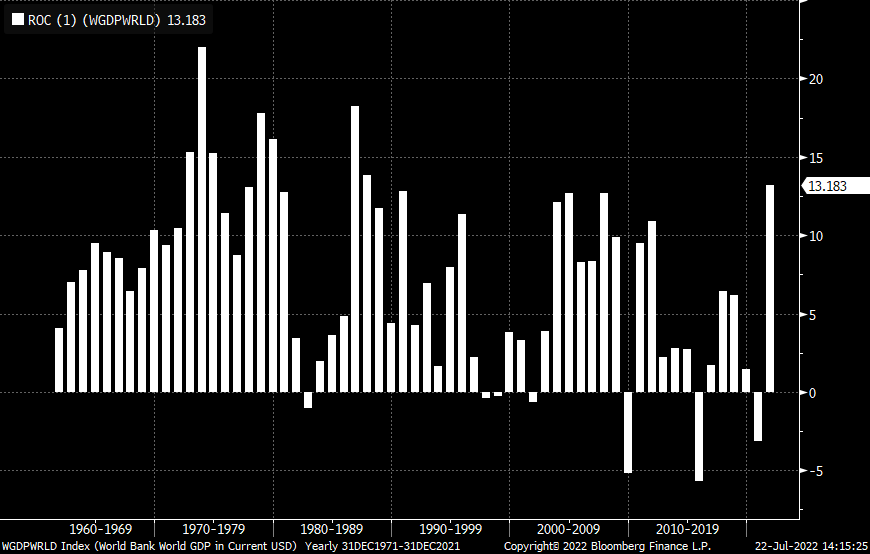
This should be no real surprise as the 12m Rate of Change in Commodities has just flipped negative
Energy remains the standout - which we will come back to later - but it has also started to rollover. Below is approximate shift in Gasoline prices if you rebased them to oil prices.
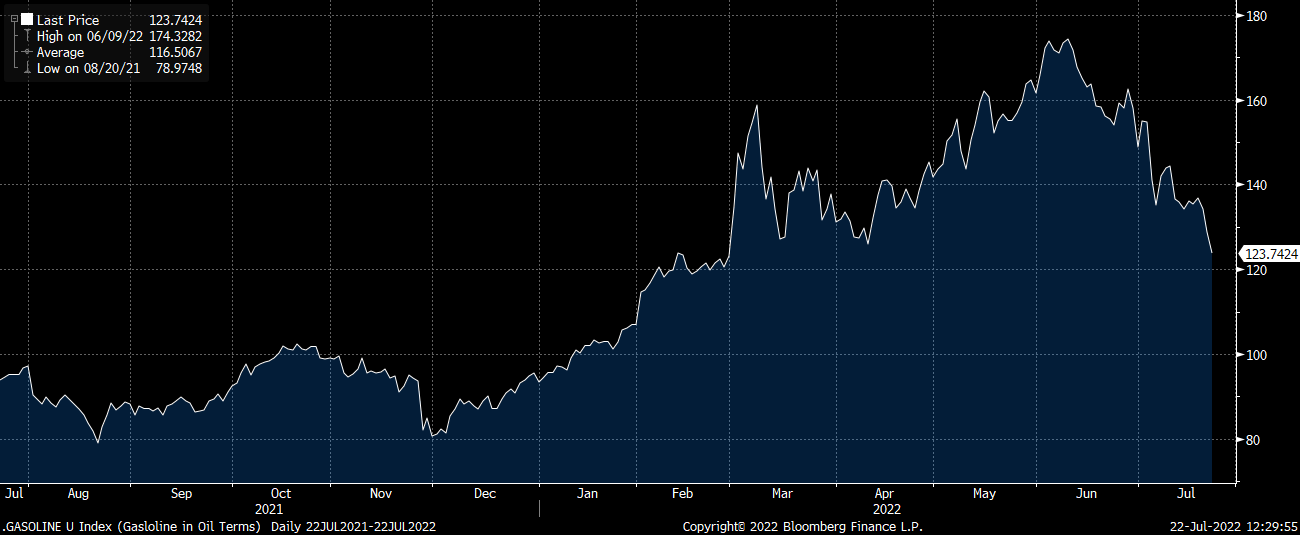
It will take some time for the rate of change on this chart to rollover annually but if the current trend were to continue by Q3 we could see energy pressure start to dissipate. In a more stable market - we are 9 months away.
Services are more complicated - and the super micro is above my pay grade. Firms are battling with increased costs - especially labour, goods and financing - at a moment when consumers (especially in the US) have excess savings. This is allowing them to push price rises through. It is far less clear how this resolves.
You can see the dichotomy between the US and RoW in BAML’s Consumer Deposits data. US on the left, Global on the right.
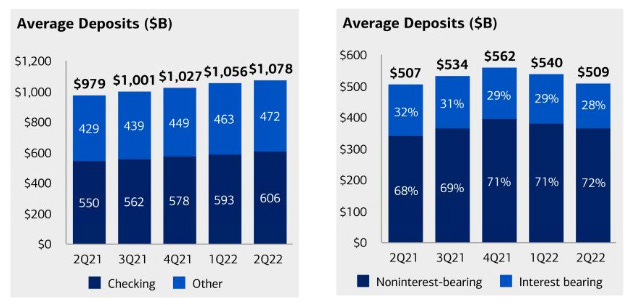
This is making the inflation pressure stickier than in previous episodes.
Enough of the long winded intro - What is the Tail Risk I foresee
I used to work with this fantastic trader called Jimmy - he was an old school Comex guy and we would trade Copper together at my last job. Jimmy liked a down tape.
His view was that bull markets are quite gradual, bear markets unfold quickly. He wanted to make money quickly when he did and so it suited him well.
“USD is up, Sell Copper”
I would assume Jimmy has had a good few months.
However there is lesson to be learnt here. Due to the speed of declines we experience in recessionary periods - the world experiences a very fast deflationary shock.
It is this shock that allows the policy pivot.
Without - a fast downdraft in both prices and expectations, it is very hard to justify aggressive action from central planners - whether it be monetary or fiscal.
As a side point - this is why I am more positive on Southern Europe than market consensus.
Wartime spending negates the need for a shock and when I look at the fiscal runway between Europe and US. Europe is ~Unlimited and US is very constrained.
Europe’s main problem is it believes the problems of the world can be solved with a pen rather than action. War on its border are showing the limitations of this (facing down the barrel of a gun generally does) and we are starting to see glimmers of actual spending.
So what constitutes a down draft.
Let’s go back to energy -> In the last 4 recessions, oil has fallen by the following:
Early 90’s → ~60%
Early 00’s → ~57%
GFC → 77%
Covid-19 → ~80%
This gives us an average of just shy of a 70% decline - in spot Brent that would mean Oil would need to fall to around $40 today. With a range using the above drawdowns of $57-$27.
Given the current backdrop in the energy market - it would be very difficult for such a fall to happen. Let’s go through the setup:
(I’m going to steal a few numbers from industry peers and the global banks here)
The US SPR releases of between 10-15m barrels a week are due to end in Q3
China has been in partial lock down for ~3 months
We are going to lose 2-2.5mbpd from Russia by year end
We are a LONG way below trend growth due to Covid
Pierre Andurand outlined the current state of the Oil market in reference to trend growth

When you look at this graphically - you see quite how surreal the situation we are in is:

What does this mean? In lay terms - assuming China ends its zero covid policy, we are going to need more than a regular recession to create a big deflationary impulse in the oil market. If we returned to trend growth - we would need just shy of a 10% contraction in GDP to balance the oil market.
We are in fact going to need the biggest recession in the last 70 years
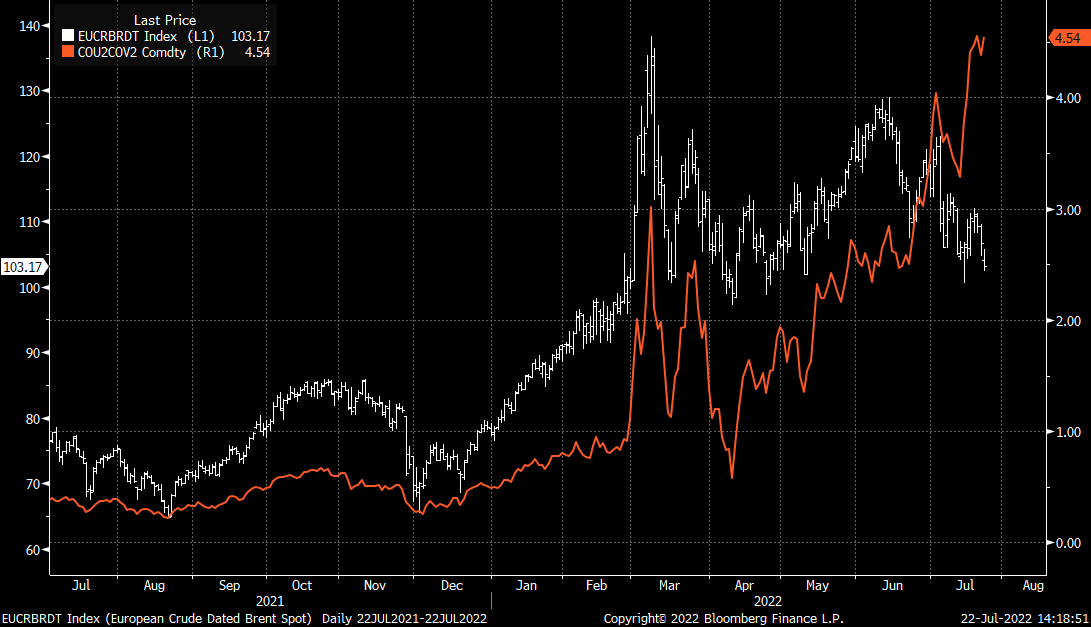
And we can see this dichotomy playing out in real time - Spreads (physical term structure) and Price should be relatively correlated. During this recent sell-off, spreads have continued to tighten as the oil price has rolled over
What does this mean? To me I see the energy deflationary impulse from recessionary conditions being significantly impaired or blunted (as the title suggests)
Whilst oil is the most pronounced tightness in the commodity markets. Many other markets also exhibit somewhat similar properties and the situation in energy is making it worse.
Consider
Global fiscal planning is becoming more centralised around the electrification of the global energy system - this is incredibly metal intensive. We haven’t even really started and copper supply will peak out in the next 2 years. We see repeated comments on this sell off that the micro and macro are not aligning.
The energy crunch in Europe - initially driven by a move to intermittent renewables, and latterly by the Ukraine conflict - is causing European production of fertlisers, metals, chemicals and many others to be impaired. This is removing supply from the market.
Sanctions on Russia are removing vast amounts of accessible/readily transportable resources from the market until new transport routes are developed
We effectively have a global spare capacity crunch occurring with many willing bidders still in the market.
Again this does not mean that deflationary pressure is averted, but it is certainly muted.
The second factor I want to return to is housing.
I wrote some thoughts here:
I am on the bid in housing. I would like to buy a family house with my wife to start a family with. I have been on the bid for 18m. We have bid on a couple of properties over asking price only to get significantly outbid by another buyer. As a trader, I try to practice patience but in this scenario it has been a painful strategy.
There are A LOT of similar people to me. I speak to them daily.
Yes. Affordability has been impaired by higher mortgage rates for all but under the market are layers and layers of bids.
I spoke to a friend of ours who has ~$125m rental portfolio in the area of London that I live. His comments were interesting:
Tom said:
This is the hottest rental market he has ever seen
Enormous amounts of rental supply have been taken from the market due to tax changes
Housing supply has become so impaired by REGULATION, building costs and tax changes that certain areas are unable to handle the demand to live within them
Again - the Micro and Macro are at odds. Yes the macro picture says housing goes much lower, but the micro conditions to really flush the market are not there.
We need excesses, instead with have jubilance that is getting blunted.
If look at the US - whilst it is decelerating. There is simply not that much supply and impairments from Covid - in terms of build times - have made it worse.
Months of Housing Supply US
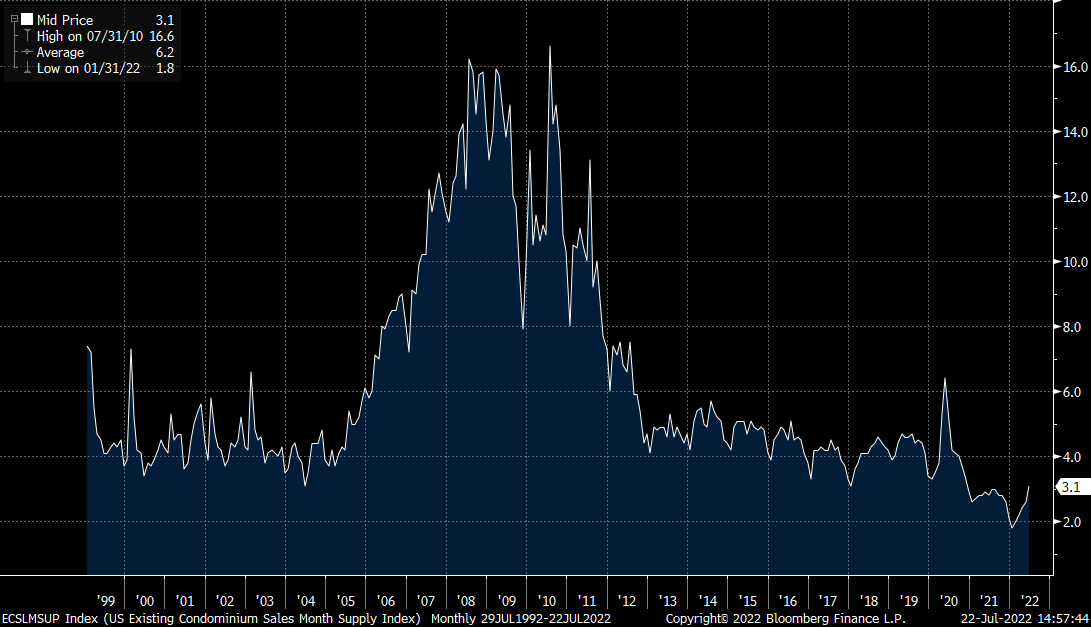
There is undoubtedly an inventory overhang in retail consumables where corporates all thought they were taking market share. However from the housing earning calls I have listened to in Q2 - the homebuilders seemed quite focused on using any supply chain benefits to reduce the current build times that they are experiencing.
Again - housing will be impaired from macro. And yes, the people who have piled money into lower tier areas as the great resignation/remote bomb has grown are probably going to feel the heat. However the starting supply constraint is so meaningful that it is harder to have a systemic deflationary pulse - as has been the case previously.
I see this as a further blunting of deflationary pulses in the macro world.
How does this create a significant Tail?
The western world is hyper financialised. We are reliant on financial assets for income - both at a state and individual level.
This is particularly the case in the US. The financial economy in many ways is the economy.
Policy has been extraordinarily supportive of this in the last decade and only for the first time in multiple decades have we seen this reverse recently. Assets have got crushed since.
In real terms - the Vanguard Retirement Fund ETF is now down more than 2008.
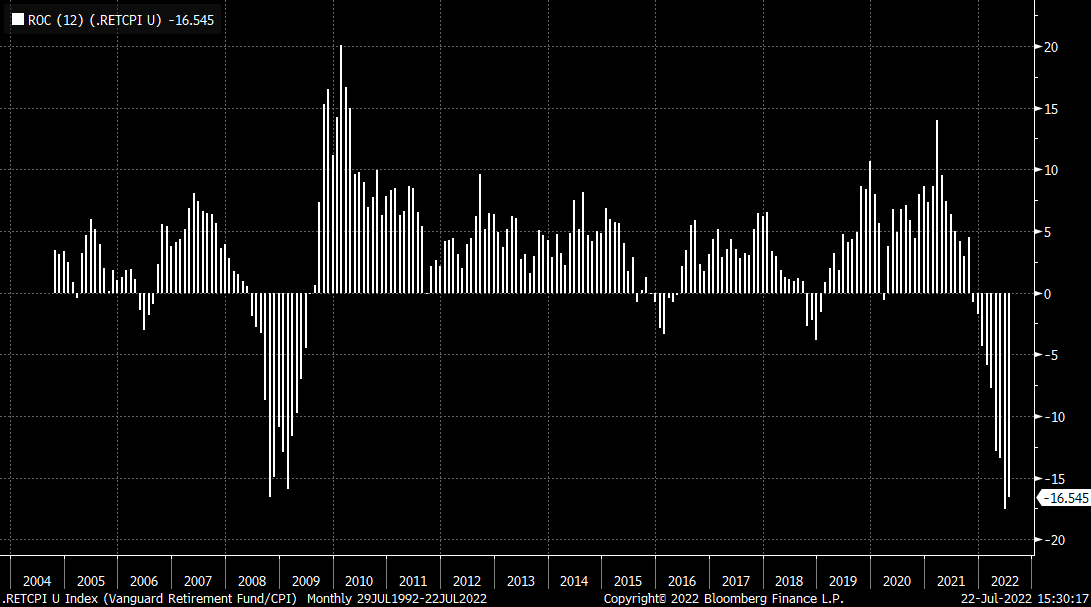
The market knows this.
And as negative cyclicality has started to kick in - the market has been very quick to price a rate cutting cycle.
The Eurodollar Futures Curve

So the Tail scenario becomes - what happens to hard assets like housing and energy if you cut rates to spur demand without a significant deflationary impulse first.
This - I believe - is how we enter the final turning of the famous Real Assets vs Financial assets chart that has been the popular over the last 5 years.

Once the central planners show that there is a pain threshold - the market psyche is going to change VERY quickly.
Pouring more demand on a supply constrained economy can only result in one outcome - as we saw with Covid.

Good Luck
G
These are long form notes im using to formalise my investment framework and explore the world of content creation. If what I have to say is interesting to you or your peers, please hit the subscribe or share. The content will always be free and I welcome criticism and discussion.
On a final note - these notes are written anonymously but in the case you decipher my identity, they represent my personal views and not those of my employer.
Great piece.
Quick Q: Are the global liquidity indicators just second-derivative changes in M2 summed across the G5? Or is there some other metric they're tracking for "liquidity"?